Since the initial release of rollover budgeting, we’ve been constantly tweaking and refining its inner workings — improving robustness, and ensuring that it works for all of the use-cases you can throw at it. With the fundamentals all operating smoothly, it’s high time we turned our attention to the visual side of rollover budgeting, and we’re excited to share the result!
At its core, rollover budgeting changes how much you can spend (or earn) in a given period before you exceed your budget. If you under-spend on your weekly craft beer budget this week, then you’ll have more to spend next week before going over budget — or, you can keep that extra surplus to be used any time in the future (or even distribute it to another budget altogether).
Visually, however, this information has been represented in PocketSmith in a highly simplified manner ever since rollover budgeting was first introduced: on the Trends chart, an additional dark purple Budget with rollover line was added to compliment the usual Budget line. This new line represented your adjusted budget amount after taking rollover into account, but aside from this, each budget period was treated no differently than a regular (non-rollover) budget period. It also had the unwanted side effect of giving the impression that you need to adhere to the new, adjusted, budget amount — which goes against one of the key aspects of rollover budgeting: being able to carry over a surplus from one budget period to the next as far into the future as you’d like.
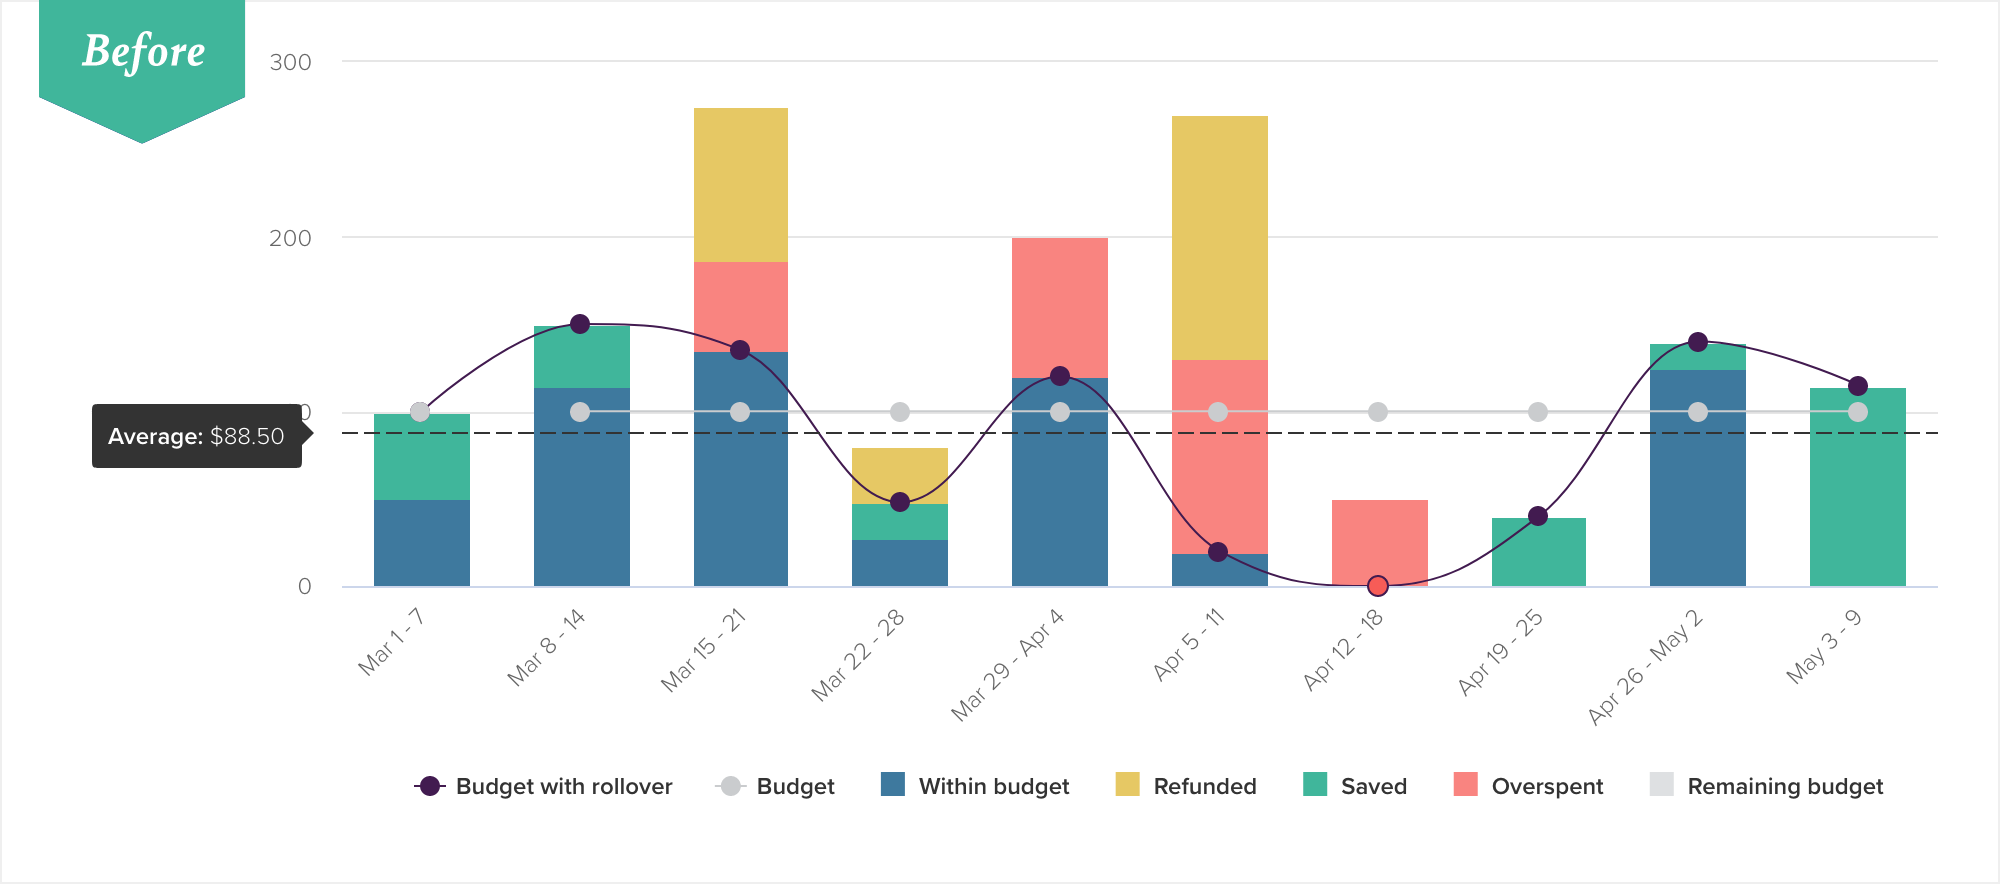
The original Trends chart with opaque rollover information
Rollover budgeting is much more nuanced than this visual representation. Notably absent is any insight into the actual surplus and deficit, and what portion (if any) of those is being carried over to subsequent budget periods. While the popup for each column includes some rollover information, this is still limited to just the rollover adjustment amount — a positive or negative amount added to your usual budget amount.
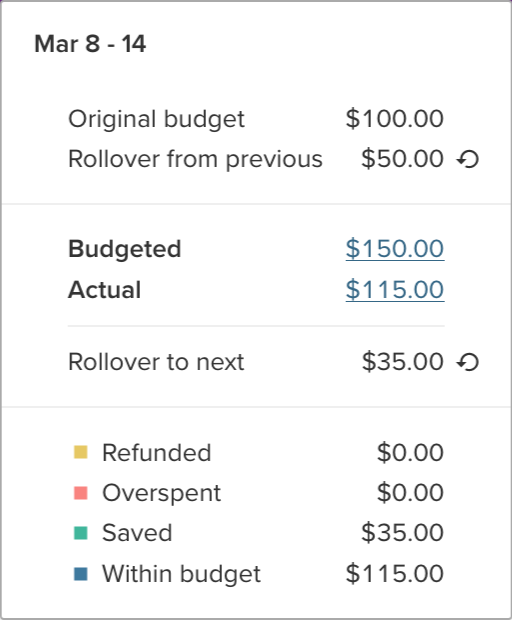
The original Trends chart popup
To help better visualize the key aspects of rollover budgeting we’ve enhanced the Trends chart to show more detail when a budget period has a rollover surplus or deficit:
The usual column segments have been split to show the portions that relate to a rollover surplus or deficit, providing much-needed insight into things like how much surplus has been used vs how much has been carried over to the next budget period, and helping to build a clearer picture of how and why a budget period has been adjusted up or down.
As before, information about rollover budgeting can only be shown when the Trends analysis is set to View by budget period in the toolbar.
The chart legend has been spruced up and organized into logical groups to make it easier to understand what each item represents.
The budgeted amount lines (light grey and dark purple) have swapped colors; now it is the usual budget amount shown in dark purple, and the rollover-adjusted budget amount is light grey, making it clear that the more prominent line is the budget’s baseline — any rollover adjustment will be added to, or subtracted from, this line. This means that the rollover-adjusted line is much less prominent before, better illustrating that this is not a target that you have to adhere to.
We’ve moved the yellow Refunded/Deductions segment to sit alongside each column, rather than being stacked on top, visually separating these amounts from the main columns and reducing cognitive load.
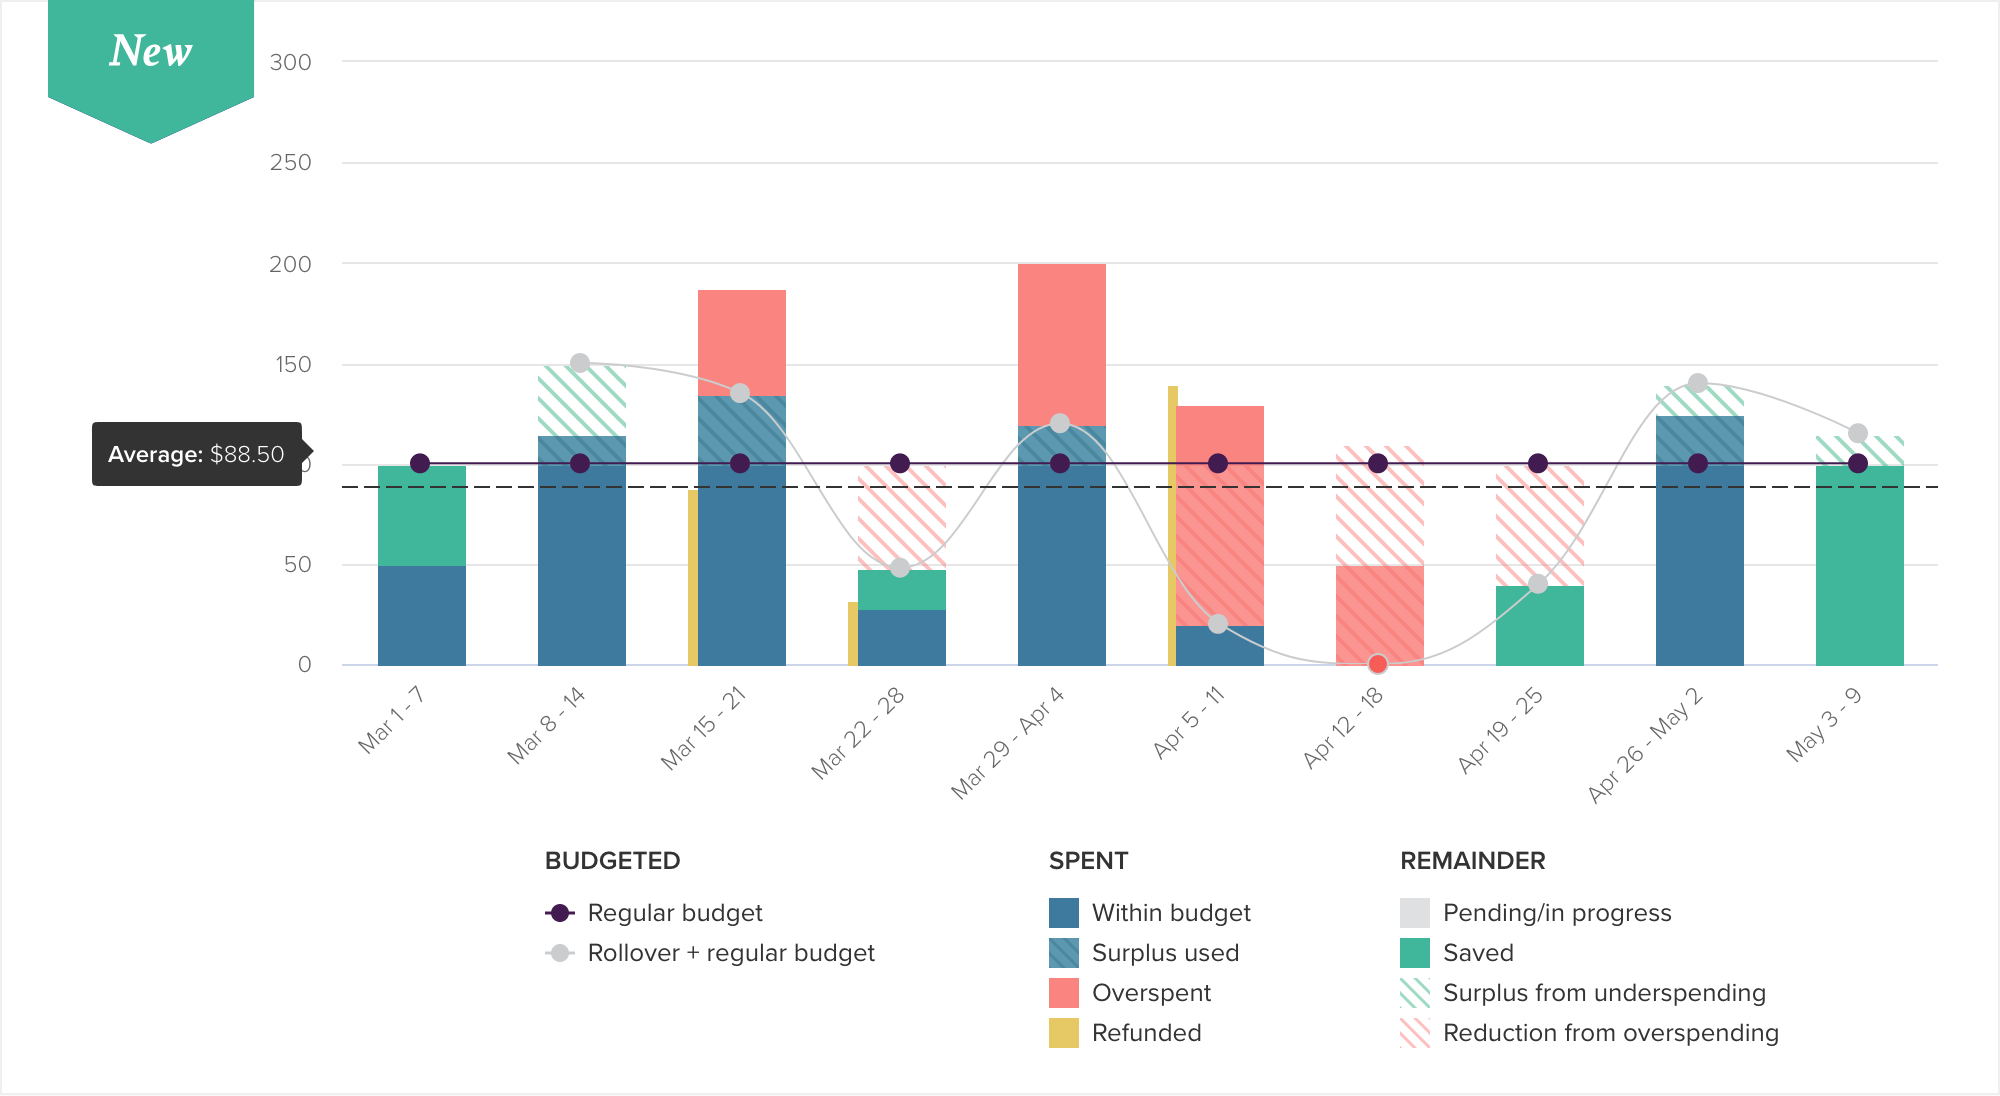
The new Trends chart with a clear rollover breakdown
The breakdown is also reflected in the popup for each column, with unimportant information (such as the $0 Refunded and Overspent amounts shown in the screenshot of the original popup) removed:
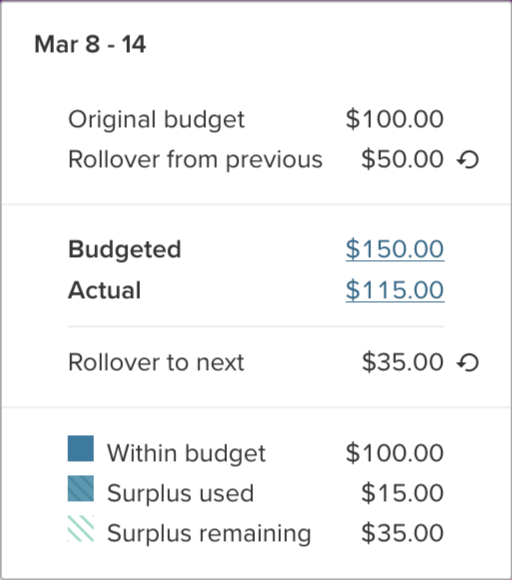
The new Trends chart popup
There’s still more in the pipeline for rollover budgeting in order to bring similar detail to other parts of PocketSmith, so stay tuned. As always we appreciate your feedback so don’t hesitate to get in touch!

Mike is a software engineer at PocketSmith and chief architect behind rollover budgeting. He’s a burgeoning woodworker and not-half-bad ukulele player, and has been getting a little too carried away with home automation.